RECOMMENDATIONS:
THAT the
following tax capping options be adopted for
properties in the commercial, industrial and multi-residential classes for 2005
and future tax years.
1.
Assessment related tax
increases be limited to an amount which is the greater of:
a.
10% of the prior year’s
annualized property taxes; or
b.
5% of the prior year’s
property tax at Current Value Assessment (CVA);
2.
Properties for which tax
increases have been capped but are within $250 of their full CVA tax, be moved
to the CVA tax level;
3.
Properties for which tax
decreases have been clawed back but are within $250 of their full CVA taxes, be
moved to their full CVA level of tax;
4.
Eligible properties (new
construction / new to class) within the meaning of subsection 331 (20) of the Municipal
Act, 2001, be taxed at a minimum of :
a.
70% of their full CVA tax
value for the 2005 tax year;
b.
80% of their full CVA tax
value for the 2006 tax year;
c.
90% of their full CVA tax
value for the 2007 tax year;
d.
100% of their full CVA tax
value for the 2008 tax year and beyond.
AND THAT these
recommendations be forwarded to the Regional
Municipality of York;
AND THAT the Province of Ontario be requested to
permit municipalities to exclude those properties in the multi-residential,
commercial and industrial classes that have reached their CVA level of tax from
future capping and clawback provisions.
PURPOSE:
Region of York Council will be receiving a
report and recommendations from Regional staff on “New Property Tax Capping
Options for the Commercial, Industrial and Multi-Residential Classes” on April 7, 2005. The purpose of this report is to provide Markham Council with
estimated tax impacts on properties in the Town of Markham prior to
Regional Council making decisions on new tax capping tools passed by the Province of Ontario in the
2004 Provincial Budget.
EXECUTIVE
SUMMARY:
Through
new tools included in amendments to the Municipal Act in 2004, the Ontario
Government is permitting municipalities in Ontario the option of accelerating
“assessment related” tax increases or decreases to the point where the property
is paying taxes based on “assessment multiplied by the tax rate” (no longer
having tax increases “capped” at 5% or having expected tax decreases “clawed”
back). In York Region, the authority to implement any of these tools rests with
the Regional Government. This report provides a summary of the estimated tax
impacts of the various options based on Town staff’s analysis.
The
movement of taxes for properties to full CVA tax levels across Ontario is
progressing at a relatively slow pace. This is due in part to re-assessments in
2001, 2003 and 2004 which have caused a continuing the need for capping because
of inconsistent increases in assessment values for individual properties within
each property class as well as the low 5% limit on assessment related
increases. The Province of Ontario initially introduced legislation that provided capping protection for
the years 1998 to 2000 and then in 2001 extended the 5% annual cap
indefinitely. While affording protection, this extension means that many
properties that were overtaxed in 1998 will not achieve CVA taxes for
years.
A
number of new tools have been provided by the Province for 2005. Analysis of
these tools shows that their full implementation would bring 32% of properties
in the commercial, industrial and multi-residential classes in Markham to
full CVA taxes. Currently, there are only 13% of these properties in Markham at
full CVA. The Region of York report recommends the use of all the tools, which
are discussed in greater detail in this report.
BACKGROUND:
At its meeting of Feb 14th,
2005 this
committee received a report entitled “2005
Property Tax Options” that summarized the property tax options that are available to
municipalities in 2005. In the report, staff noted that the estimated tax
impacts of the various options would be presented to this committee prior to
the options being considered by York Regional Council. This report provides
these estimated impacts.
Currently, residential properties are taxed at full
CVA. The non-residential classes – commercial, industrial and multi-residential
– are subject to the 5 % capping provisions under Provincial legislation. To
fund the 5% cap, it is necessary retain (or claw back) tax decreases for those
properties in each class that are currently paying more than their CVA level
taxes. The amount retained is calculated on a percentage basis and is referred
to as the “clawback “rate. It represents the
percentage retained.
Table 1 shows the 2004 clawback rates for York Region:
|
Property Class
|
2004 Clawback Rates
(% of Decrease Retained)
|
|
|
%
|
|
Multi-Residential
|
100.00
|
|
Commercial
|
84.02
|
|
Industrial
|
81.55
|
In the Town of Markham there are a total of 4,642 non-residential
properties subject to capping provisions.
This “Status Quo” option is shown in Table 2 below.
|
Table 2
Status Quo – Properties Subject to Capping Provisions at 5% for
2005
|
|
|
No. of properties
|
Per Cent of total
|
|
Capped - Properties
|
2356
|
50.75%
|
|
Clawback - Properties
|
1622
|
34.94%
|
|
At CVA -
Properties
|
584
|
12.58%
|
|
New Construction
- Properties
|
80
|
1.72%
|
|
Total
|
4642
|
100%
|
OPTIONS/DISCUSSIONS:
New Tax Policy
Options
The Ontario Government has provided for five new
capping options. The “Status Quo” option retains a 5% cap and is presented for
comparison in the illustrations that follow. The new options can be used
separately or in combination. The options are presented in combination which
achieves the maximum number of properties moving to full CVA.
Municipalities can:
- Increase
the annual cap from 5% to up to 10% of previous year’s taxes;
- Implement
a minimum annual increase of up to 5% of the prior year’s full CVA
level taxes (Municipalities can implement the greater of 1 or 2);
- Move capped
properties (those paying less than full CVA) directly to CVA taxes if they
are within $250 of their CVA taxes.
- Move
clawed-back properties (those paying more than full CVA) directly to CVA
taxes if they are within $250 of their CVA taxes.
- Minimum
tax level of 70% for eligible New Construction properties in 2005,
increasing to 100% by 2008.
ANALYSIS
AND OPTIONS
The analysis in this report utilizes the provincial
flexibility to combine each option. In other words, each is additive so that
Option 4 incorporates Options 1 through 3. The reference to each option in this
report matches those in the Region report for ease of comparison.
Option 1: Increasing the cap from 5%
up to 10% (“10/0/0/0”)
This option, termed “10/0/0/0” would increase the
annual cap from the current 5% of the previous year’s taxes to a maximum of 10%
and results in accelerating the rate of movement of capped properties to CVA.
This is the most effective option in instances where properties are currently
taxed at more than 50% of their CVA taxes.
The option of increasing the
5 % cap to 10%, results in more properties being capped and therefore moving
closer to full CVA. Capped properties would see their taxes increase by 10%
while the clawback rates decreases from 2004. The
majority of properties in the clawback position are commercial and industrial
condominiums.
|
Impact of Option 1: Number of
Properties
|
|
|
Capped
|
At CVA
|
Clawback
|
|
Status Quo
|
2356
|
584
|
1622
|
|
Option 1
|
2138
|
802
|
1622
|
Option 2: 5% of Prior Year’s Full CVA Taxes (“10/5/0/0”)
The second option, termed “10/5/0/0”, involves
applying an increase of up to 5% of the prior year’s CVA taxes; this is the
most effective tool to move properties with low levels of taxation (0% to 50%)
closer to CVA taxes (100%). This option moves an additional 104 properties with
levels of taxation (0% - 49%) to levels greater than 50%. The majority of
properties that have increased over the 49 % level of taxation are: vacant
land, or commercial condominiums.
|
Impact of Option 2: Number of
Properties
|
|
|
Capped
|
At CVA
|
Clawback
|
|
Status Quo
|
2356
|
584
|
1622
|
|
Option 1
|
2138
|
802
|
1622
|
|
Option 2
|
2138
|
802
|
1622
|
While Option 2 does not
result in moving additional properties to full CVA tax, it does move more
capped properties closer to CVA.
Option 3: Applying a $250 Threshold to Capped Properties
(“10/5/250/0”)
The third option, termed “10/5/250/0”, allows
municipalities to bring capped properties that are within $250 of CVA taxes
directly to the CVA tax level. These properties are currently capped and taxed
below their CVA taxes and for which an increase is required to get to CVA tax
levels. The result is that these properties are removed from capping
protection.
|
Impact of Option 3: Number of
Properties
|
|
|
Capped
|
At CVA
|
Clawback
|
|
Status Quo
|
2356
|
584
|
1622
|
|
Option 1
|
2138
|
802
|
1622
|
|
Option 2
|
2138
|
802
|
1622
|
|
Option 3
|
1938
|
1002
|
1622
|
This option reduces the
number of properties receiving capping protection and moves them to full
CVA.
Option 4: Applying a $250 Threshold to Properties Clawed-Back
(“10/5/250/250”)
This option referred to as the “10/5/250/250”, allows
municipalities to move properties that are currently clawedback
(properties that are paying above CVA level taxes) but are within $250 of their
CVA taxes to CVA level taxes. This option would bring 1470 properties to CVA,
but it also increases the clawback rate slightly to the balance of the classes
because there are fewer clawback properties.
|
Impact of Option 4: Number of
Properties
|
|
|
Capped
|
At CVA
|
Clawback
|
|
Status Quo
|
2356
|
584
|
1622
|
|
Option 1
|
2138
|
802
|
1622
|
|
Option 2
|
2138
|
802
|
1622
|
|
Option 3
|
1938
|
1002
|
1622
|
|
Option 4
|
1938
|
1470
|
1154
|
Option 5: New Construction / New-To-Class: Minimum of 70% tax for 2005
Under the provisions of the Act, “eligible properties”
for new construction or new to a property class are to be taxed at the same a
tax level representing the average tax rate of up to six comparable properties.
The properties appear on the Assessment Roll and are initially billed at full
CVA taxes but are subsequently adjusted based on the comparable property
levels, possibly requiring an adjustment to their taxes.
For 2005, the minimum percentage is 70%, rising by 10%
each year, to the maximum of 100% in 2008 and beyond. This applies only to new
properties in 2005 and not to properties already capped in prior years. This
option should be used with all other tax tool options.
Summary
Chart 1 below shows the number of properties affected
by the options in Markham. It
illustrates that as properties move from the Status Quo through Option 4, the
number of capped properties decrease, and the number of properties at CVA
increases. The number of properties eligible for new construction tax treatment
remains constant.
The number of capped properties decreases by 418 from
2356 under the status quo to 1938 under Option 4, while there are 886 more
properties moving to CVA (584 to 1470) and the number of clawedback
properties decreases from 1622 to 1154.
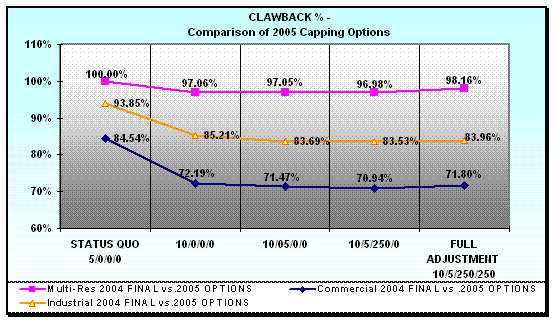
Chart 2 below
illustrates the change to the clawback rates for the
Status Quo vs. the four Options. This is the percentage that must be retained
to fund capped properties. Although the rates drop dramatically from the Status
Quo, they are relatively the same through the four options. Only under Option 4
is there a slight increase in the clawback rate from
the other options because there are less properties in
the clawback pool to fund the capped properties.
Chart 1: Property Impacts for Status Quo vs. the 4
Options
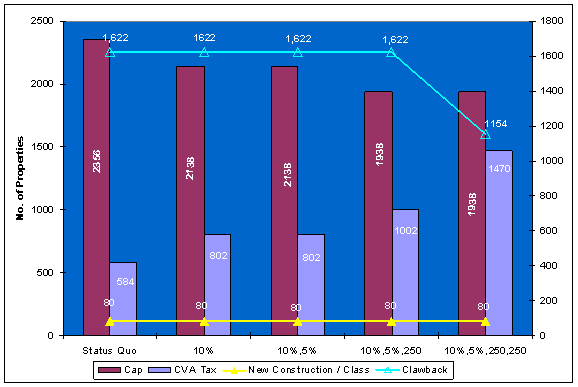
Chart 2: Clawback Rates - Status Quo vs. the 4 new Options
Staff of the Town of Markham are in agreement with the
recommendations of Regional staff so that their implementation will move
properties closer to full CVA which results in more equitable treatment of
taxpayers in the business classes.
Properties
That Have Reached Their CVA Tax Levels
Although the Province has provided additional tax
tools for municipalities, its legislation did not include a requirement that
once a property achieves CVA that it remain at CVA. The options presented here,
particularly the $250 threshold, move a number of properties to full CVA. The
objective of moving properties to CVA taxes is simply the attempt to achieve
taxpayer fairness by removing the inequities that currently exist in the
business classes.
Fair treatment of taxpayers in the business classes
could be more consistently achieved once a property reaches its CVA level taxes
and remains at the CVA tax level for future reassessments. This would require a
change in legislation to achieve this goal.
The Association of Municipal Tax Collectors of Ontario and the Region of
York are recommending that the Province be requested to allow municipalities to
maintain properties at CVA level taxes once properties have reached the CVA tax
level.
FINANCIAL IMPLICATIONS
Provincial capping and clawback provisions pertain
only to reassessment related property tax increases and decreases in the
Commercial, Industrial and Multi-residential classes. Tax increases as a result
of municipal budgetary requirements are not affected.
There are no direct financial implications to the Town
of Markham except where there is a region-wide
shortfall in a particular class to fund the cost of the protection afforded
under the legislation. The projected shortfall in 2005 under the Status Quo
option is estimated at just over $220,000; the use of the “Recommended” option
allows for a projected elimination of the shortfall.
CONCLUSION
It is recommended that the Town of Markham encourage the movement of properties to
full CVA taxation by applying the recommended combination of tax tools for each
of the protected property classes. In addition, it is recommended that a
minimum percentage of CVA level taxes be established for new construction and
new-to-class properties starting in 2005. The level of taxation is to be set at
a minimum of 70% for the 2005 taxation year, rising by the maximum of 10% each
year to 100% of the full CVA tax obligation of those properties in 2008 and
beyond.
As
noted previously, the decision to implement tax policy tools is the
responsibility of York Regional Government. On April 7, 2005 a report will be tabled to the Region’s Finance and Administrative
Committee recommending the use of all of the tax tool options. It is
recommended that Markham support the York recommendations provided that it is acknowledged that in 2006 it is
possible that some properties that will have been moved to full CVA under these
proposals might move to either a cap or clawback position. If the Provincial
Government amends legislation to ensure that once a property achieves CVA it
stays there then this issue will disappear.
FINANCIAL CONSIDERATIONS:
None
ATTACHMENTS:
Appendix A: Tax Options
|
|
|
|
|
|
|
Andy Taylor, Commissioner, Corporate Services
|
Q:\Finance and Administration\Finance\SHARED\2005 General Committee
Finance\0509 2005 Property Tax Options Tax Impacts.doc
APPENDIX
A: Tax Options
Appendix A shows the tax impact and the number of properties affected
under each of the options.
Regional staff with input from lower tier staff completed their report
based on 2004 data and Markham staff used the
latest 2005 data from the OPTA database. As a result, the actual clawback rates and impacts differ slightly but do not
substantively change the analysis.
The figures in the following charts represent most but not all selected
property types.
Option 1: Increase cap
from 5% to 10%
Table 1: Clawback
Rate Comparison
|
Property Class
|
Option 1 -Estimated Clawback
|
2004 Clawback
|
|
|
97.06
%
|
100%
|
|
|
72.19
%
|
84%
|
|
|
85.21%
|
81%
|
Table 2: Property Impacts based on Option 1
|
Percent of CVA Taxes
|
0 to 29.9
|
30 to 49.9
|
50 to 79.9
|
80 to 99.9
|
CVA
100 %
|
101 to 115
|
116 to >
|
Total
|
|
Car Dealership
|
|
1
|
3
|
8
|
4
|
7
|
|
23
|
|
Commercial Condo
|
27
|
756
|
446
|
129
|
112
|
208
|
306
|
1984
|
|
Hotel
|
|
|
1
|
1
|
2
|
7
|
2
|
13
|
|
Industrial Condo
|
3
|
2
|
9
|
131
|
336
|
319
|
24
|
824
|
|
Industrial
|
3
|
12
|
56
|
106
|
270
|
399
|
63
|
909
|
|
Office
|
1
|
6
|
12
|
9
|
20
|
72
|
36
|
156
|
|
Retail
|
1
|
12
|
44
|
61
|
56
|
73
|
27
|
274
|
|
Vacant Land
|
30
|
63
|
53
|
8
|
32
|
10
|
7
|
203
|
|
Grand Total
|
65
|
852
|
624
|
453
|
832
|
1095
|
465
|
4386
|
Note: Only selected Non-Residential properties are shown.
Option 2: Increase cap
from 5% to 10% and/or the greater of 5% of prior years CVA taxes
Table 3: Clawback Rate Comparison
|
Property Class
|
Option 2 - Estimated Clawback
|
2004 Clawback
|
|
|
97%
|
100%
|
|
|
71%
|
84%
|
|
|
83%
|
81%
|
Table 4: Property Impacts based on Option 2
|
Percent of CVA Taxes
|
0 to 29.9
|
30 to 49.9
|
50 to 79.9
|
80 to 99.9
|
CVA
100 %
|
101 to 115
|
116 to >
|
Total
|
|
Car Dealership
|
|
1
|
3
|
8
|
4
|
7
|
|
23
|
|
Commercial Condo
|
24
|
736
|
474
|
129
|
112
|
217
|
292
|
1984
|
|
Hotel
|
|
|
1
|
1
|
2
|
7
|
2
|
13
|
|
Industrial Condo
|
2
|
3
|
9
|
131
|
336
|
323
|
20
|
824
|
|
Industrial
|
4
|
11
|
57
|
106
|
270
|
401
|
60
|
909
|
|
Office
|
1
|
6
|
12
|
9
|
20
|
73
|
35
|
156
|
|
Retail
|
0
|
13
|
44
|
61
|
56
|
73
|
27
|
274
|
|
Vacant Land
|
28
|
63
|
55
|
8
|
32
|
10
|
7
|
203
|
|
Grand Total
|
59
|
833
|
655
|
453
|
832
|
1111
|
443
|
4386
|
Note: Only selected Non-Residential properties are shown.
Option 3: Increase cap
from 5% to 10% and/or the greater of 5% of prior years CVA taxes plus applying
a $250 Threshold to Capped (Increaser) Properties
Table 5: Clawback
Rate Comparison
|
Property Class
|
Option 3 - Estimated Clawback
|
2004 Clawback
|
|
Multi-Residential
|
96.98
%
|
100%
|
|
Commercial
|
70.94
%
|
84%
|
|
Industrial
|
83.53
%
|
81%
|
Table 6: Property Impacts
based on Option 3
|
Percent of CVA Taxes
|
0 to 29.9
|
30 to 49.9
|
50 to 79.9
|
80 to 99.9
|
CVA
100 %
|
101 to 115
|
116 to >
|
Total
|
|
Car Dealership
|
|
1
|
3
|
7
|
5
|
7
|
|
23
|
|
Commercial Condo
|
23
|
723
|
468
|
78
|
183
|
217
|
292
|
1984
|
|
Hotel
|
|
|
1
|
1
|
2
|
7
|
2
|
13
|
|
Industrial Condo
|
2
|
3
|
9
|
48
|
419
|
323
|
20
|
824
|
|
Industrial
|
3
|
11
|
55
|
94
|
285
|
401
|
60
|
909
|
|
Office
|
1
|
6
|
12
|
9
|
20
|
73
|
35
|
156
|
|
Retail
|
|
13
|
44
|
43
|
74
|
73
|
27
|
274
|
|
Vacant Land
|
27
|
62
|
53
|
5
|
39
|
10
|
7
|
203
|
|
Grand Total
|
56
|
819
|
645
|
285
|
1027
|
1111
|
443
|
4386
|
Note: Only selected Non-Residential properties are shown.
Option 4: Increase cap
from 5% to 10% and/or the greater of 5% of prior years CVA taxes plus applying
a $250 Threshold to Capped (Increaser) Properties and Clawedback
(Decreaser) Properties
Table 7: Clawback
Rate Comparison
|
Property Class
|
Option 4 - Estimated Clawback
|
2004 Clawback
|
|
Multi-Residential
|
98.16
%
|
100%
|
|
Commercial
|
71.80
%
|
84%
|
|
Industrial
|
83.96
%
|
81%
|
Table 8: Property Impacts based on Option 4
|
Percent of CVA Taxes
|
0 to 29.9
|
30 to 49.9
|
50 to 79.9
|
80 to 99.9
|
CVA
100 %
|
101 to 115
|
116 to >
|
Total
|
|
Car Dealership
|
|
1
|
3
|
7
|
5
|
7
|
|
23
|
|
Commercial Condo
|
23
|
723
|
468
|
78
|
358
|
82
|
254
|
1986
|
|
Hotel
|
|
|
1
|
1
|
2
|
7
|
2
|
13
|
|
Industrial Condo
|
2
|
3
|
9
|
48
|
637
|
103
|
22
|
824
|
|
Industrial
|
3
|
11
|
55
|
94
|
331
|
354
|
59
|
907
|
|
Office
|
1
|
6
|
12
|
9
|
23
|
69
|
36
|
156
|
|
Retail
|
0
|
13
|
44
|
43
|
78
|
69
|
27
|
274
|
|
Vacant Land
|
27
|
62
|
53
|
5
|
48
|
1
|
7
|
203
|
|
Grand Total
|
56
|
819
|
645
|
285
|
1482
|
692
|
407
|
4386
|
Note: Only selected Non-Residential properties are shown.
Option 5: New Construction /
New-To-Class: Minimum of 70% tax for 2005
Under the provisions of the Act, “eligible properties”
are for new construction or new to a property class tax treatment are subject
to property taxes at a level representing the average tax rate of up to six
comparable properties. The properties appear on the Assessment Roll and are
billed at full CVA taxes but are subsequently adjusted to the “Bill 140”
comparable levels possibly requiring an adjustment to their taxes.
For 2005, the minimum percentage is 70%, rising by 10%
each year, to the maximum of 100% in 2008 and beyond. This applies only to new
properties in 2005 and not to properties already capped in prior years.
Status Quo – Retain the 5%
Cap
Table 9 below illustrates the property tax impacts for
Non-Residential properties that are subject to the current 5 % capping
provisions under Provincial legislation referred to as the Status Quo.
Table 9: Property Impacts based on Status Quo
|
Percent of CVA Taxes
|
0 to 29.9
|
30 to 49.9
|
50 to 79.9
|
80 to 99.9
|
CVA
100 %
|
101 to 115
|
116 to >
|
Total
|
|
Car Dealership
|
|
1
|
4
|
8
|
3
|
7
|
|
23
|
|
Commercial Condo
|
30
|
855
|
365
|
139
|
81
|
170
|
344
|
1984
|
|
Hotel
|
|
|
1
|
2
|
1
|
5
|
4
|
13
|
|
Industrial Condo
|
4
|
1
|
17
|
208
|
251
|
315
|
28
|
824
|
|
Industrial
|
3
|
14
|
64
|
152
|
214
|
380
|
82
|
909
|
|
Office
|
1
|
7
|
12
|
11
|
17
|
64
|
44
|
156
|
|
Retail
|
1
|
12
|
51
|
70
|
40
|
69
|
31
|
274
|
|
Vacant Land
|
32
|
86
|
29
|
8
|
31
|
10
|
7
|
203
|
|
Grand Total
|
71
|
976
|
543
|
598
|
638
|
1020
|
540
|
4386
|
Note: Only selected Non-Residential properties are shown.